Upcoming Event
 Free Newsletter

Upstate school districts rank highest for career readiness
Staff Report //January 22, 2021//


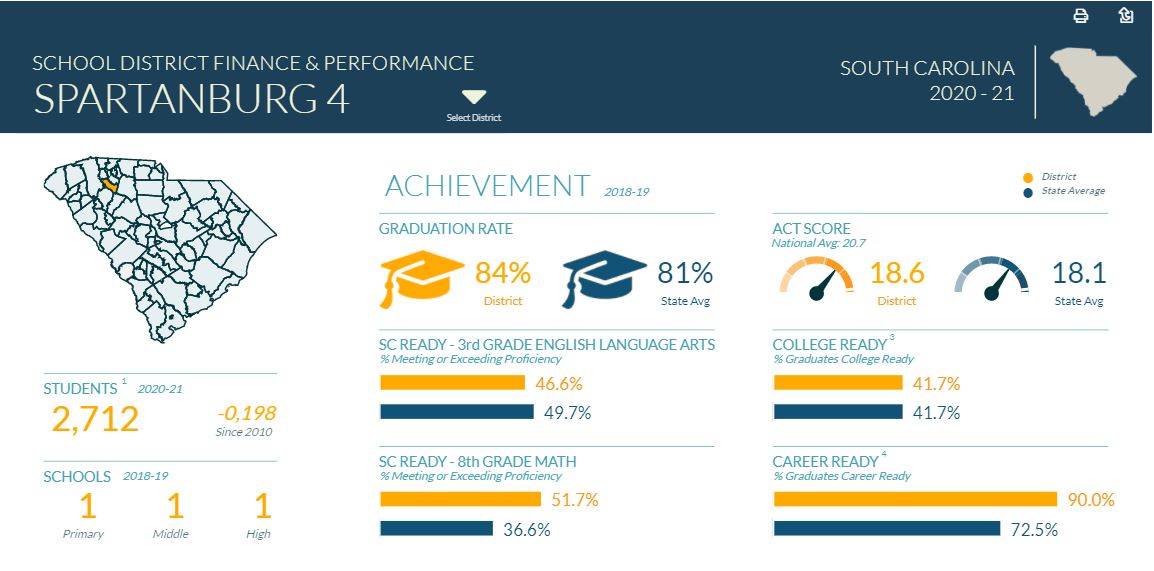 Spartanburg School District 4 and Barnwell School District 1 are neck-and-neck as South Carolina’s most career-ready school districts at a respective 90% and 92% score, followed by Anderson District 2 at 89%.
The data comes from an S.C. educational metric dashboard compiled by the Palmetto Promise Institute and Acuitas Economics, announced Tuesday. The dashboard compares data including per-pupil revenue, percent spent on instruction, graduation rate, college readiness, and total teacher and average teacher salary for each district.
“K-12 education represents 40% of South Carolina’s general fund appropriations — the largest single category — yet only a handful of people could tell you how much we spend, or more to the point, how it is spent,” Ellen Weaver, CEO and president of the Palmetto Promise Institute, said in a news release. “That must change if South Carolina is to ever deliver effective education opportunity for every student, regardless of their income or zip code.”
For the dashboard’s career readiness metric, researchers counted the percentage of students that either completed a career and technical education course and received a national or state credential, earned a silver, gold or platinum national career readiness certificate, scored 31 or higher on the Armed Services Vocational Aptitude Battery test or have finished a state-approved work-based learning program.
Barnwell District 19, York 4 and Lexington-Richland 5 score the highest for college readiness at a respective 68%, 67% and 60%, followed by Charleston School District’s 74%. College readiness metrics were determined from the percentage of students that earned higher than 20 on the composite ACT, higher than 1020 on the composite SAT, higher than 4 on the International Baccalaureate assessment, higher than a 3 on an AP exam or higher than a C+ in six or more dual enrollment courses.
“Knowledge is power,” Weaver said in the release. “This dashboard provides an understandable snapshot to better evaluate and shape critical education funding conversations and refocus those discussions on what truly matters: how our spending decisions impact students’ future.”
p